
world-society-planet · ByteSeguro Global
What Does an Air Quality Reading Really Tell You?
The colour on your phone is a starting point, not a description of every breath you take. Here is how to read it before making plans.
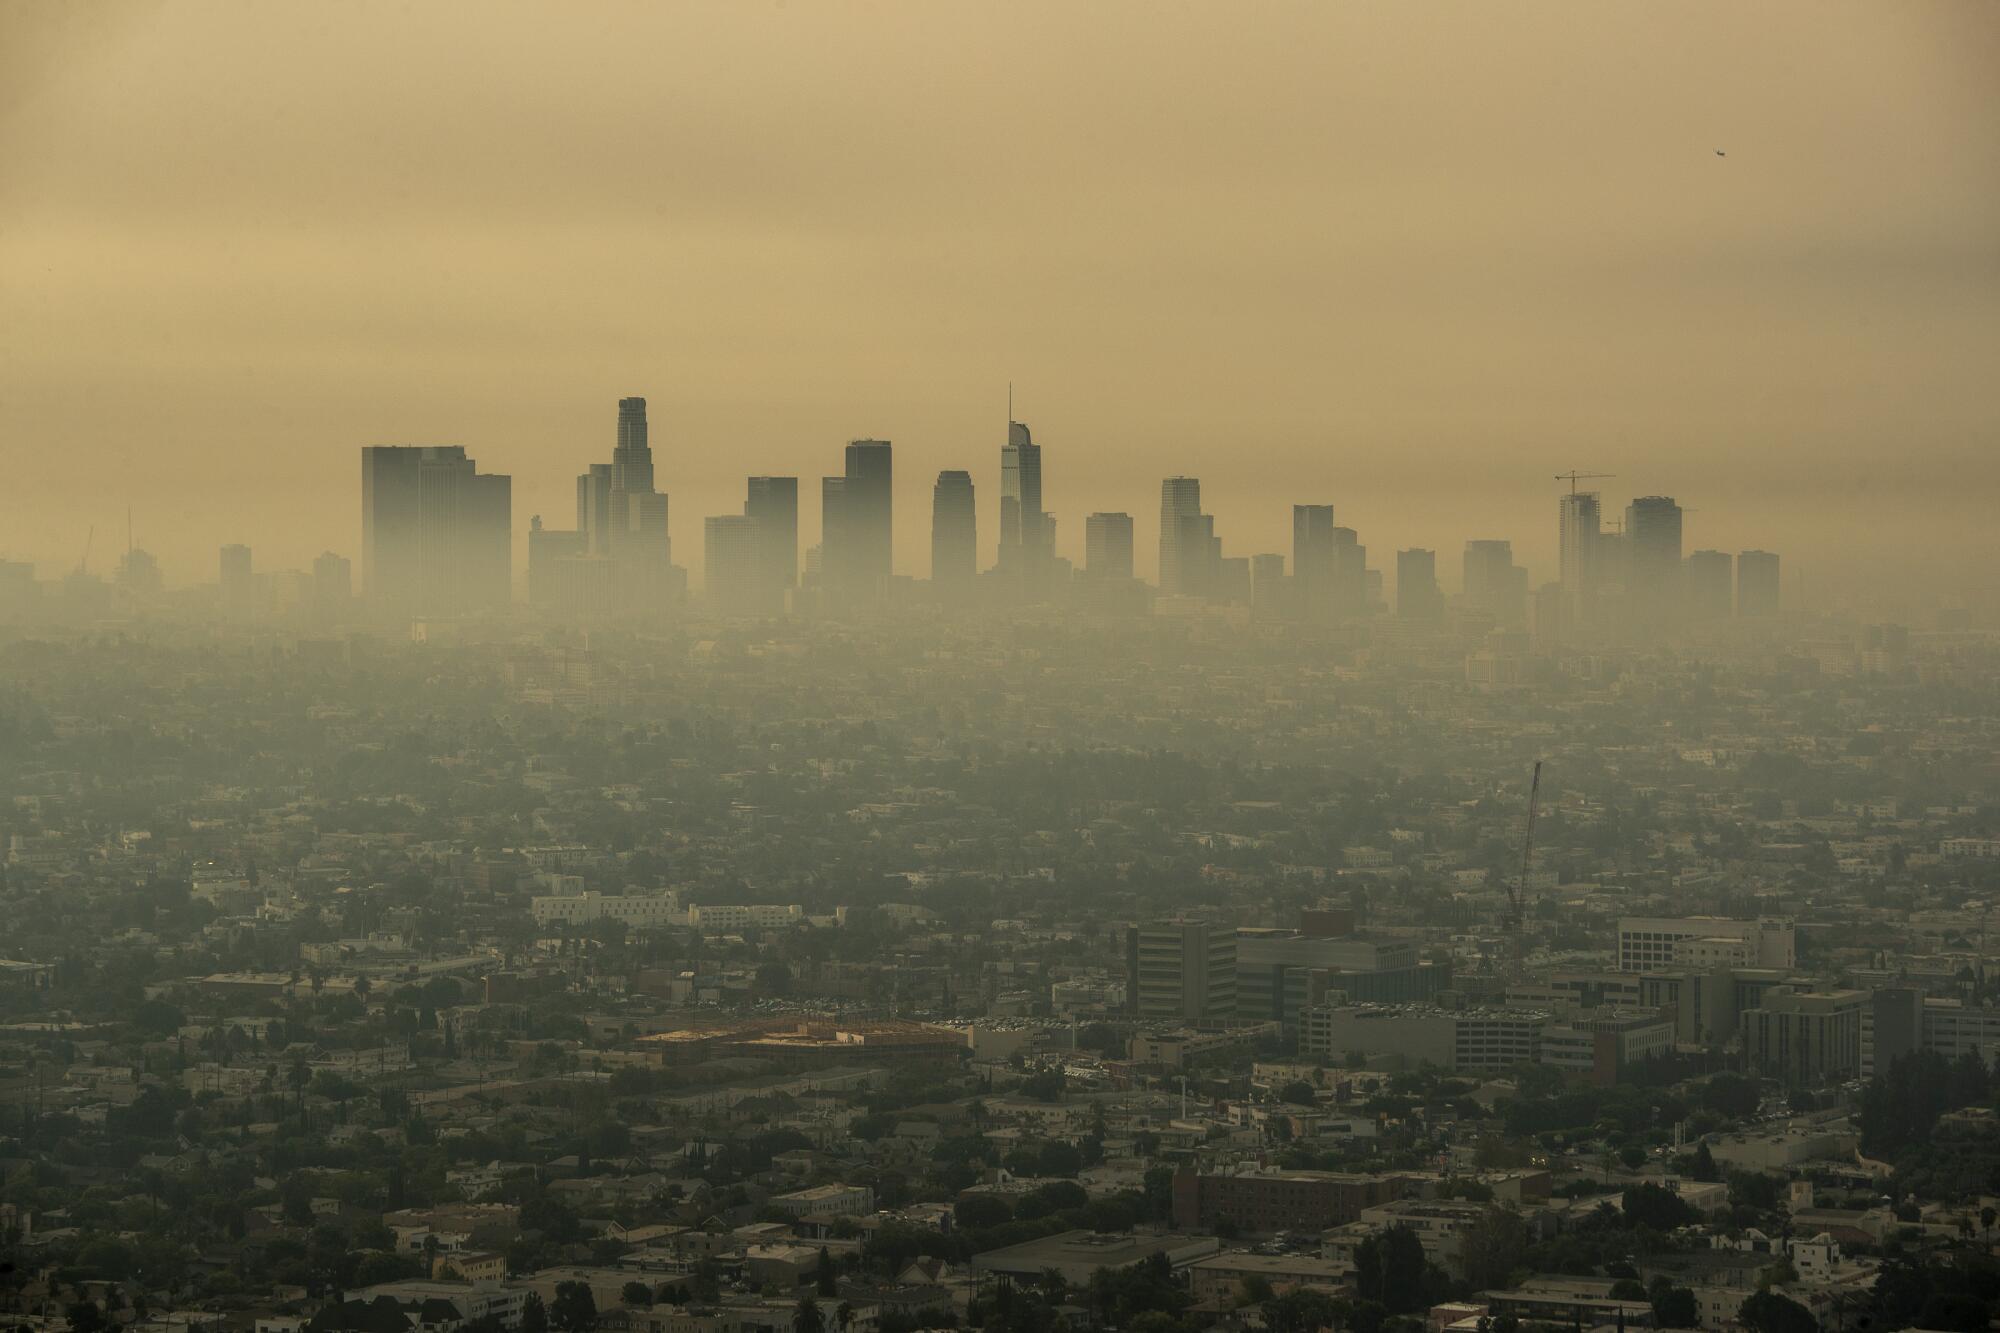

The sky looks clear. Your phone says the air is poor. A friend across town sees a different colour. Which one should you believe?
All three observations can be genuine. You are looking at different kinds of information: what the sky looks like, what a monitoring network has measured or estimated, and how an app has translated that information into a health-related category. They do not necessarily describe the same place, pollutant or moment.
The useful question is not simply, “Is today's air good or bad?” It is: “What exactly is this reading telling me, and what is it leaving out?”
A reading has an address, a clock and a definition
Imagine checking an air-quality app before a walk. You see a prominent number and a colour, but the meaning may be hidden in smaller print. Start with three details:
- Where does it apply? Is it a nearby monitoring station, a modelled estimate for a map grid, or a reading from a low-cost sensor? A value for a large area does not measure every street within it.
- When was it produced? An hourly reading, a daily summary and a forecast answer different questions. Always check the update time and whether the data are measured, estimated or predicted.
- What is being measured? The index may reflect fine particles, ozone or another pollutant, using a particular country's rules. A number without the index name and pollutant context can be misleading.
A good first habit is to open the source details instead of treating the main colour as the complete story.
Why the same number can mean different things
An Air Quality Index, or AQI, converts pollution measurements into categories intended to help people understand potential health concerns. That conversion is not universal.
For example, the United States AirNow index calls values from 0 to 50 Good and 51 to 100 Moderate. The European Air Quality Index uses a different classification system, with categories such as Good, Fair and Moderate. You cannot safely transfer the interpretation of a number from one system to another. [1] [2]
The World Health Organization publishes health-based guideline concentrations for individual pollutants. Those guidelines are not a worldwide AQI scale, and a guideline concentration should not be compared directly with an index number. [3]
That is why a screenshot labelled “AQI 75” is incomplete evidence unless you know the system, time, location and pollutant behind it.
A simple animation: read the information, not just the colour
The animated sequence below follows the same reading through four questions: source, time, pollutant and personal context. It contains no live measurements and is not an air-quality forecast. Its purpose is to teach the order of checks, rather than to imply that any particular location is safe.
Air pollution is not one substance
Fine particulate matter, usually called PM2.5, describes tiny airborne particles small enough to penetrate deeply into the lungs. Ground-level ozone is a gas formed through chemical reactions in sunlight. Nitrogen dioxide is another pollutant associated with combustion sources, including traffic. They have different sources, patterns and measurement methods. [3]
The pollutant driving the index can change as conditions change. In parts of the world, smoke from wildfires or seasonal burning can make particles the main concern. Elsewhere, sunlight and emissions can make ozone more significant at particular times. A single headline colour does not explain which process is involved.
Neither does a clear sky prove clean air. Some harmful pollution is invisible, while haze can also involve humidity or natural dust. Visible conditions can be clues, but monitoring provides a different kind of evidence.
Why your street may differ from the map
Air-quality maps often combine stations and modelling to offer broader coverage. The European Environment Agency explicitly separates station observations from a modelled layer and notes that its hourly information includes data that have not yet been formally verified. [2]
That matters because a route alongside heavy traffic, an enclosed valley and an open park can experience different conditions. A sensor attached to a building may not represent a whole neighbourhood. Low-cost sensors also vary in quality and require careful interpretation. The US Environmental Protection Agency distinguishes its regulatory-grade monitoring network from readings from portable sensors. [4]
An apparently precise number is not the same as a precise description of your personal exposure. It tells you something about the air at a particular place or in a defined estimate, not exactly what entered your lungs throughout the day.
Should a poor reading change your outdoor plans?
It may, but the right decision depends on the severity of pollution, your health, the activity and the alternatives available. Children, older people and those with heart or respiratory conditions may require particular care. Local public-health alerts and clinical advice take precedence over generic recommendations in an article.
The WHO advises people to consider changing the time, place or intensity of physical activity when pollution is high, while recognising that regular movement brings substantial health benefits. Simply telling everyone to stop exercising whenever an index is imperfect would misrepresent the evidence. [5]
For an ordinary day, a practical approach is to check local guidance, consider a less polluted route or time, and pay attention to symptoms such as coughing, wheezing or chest tightness. If symptoms are severe or unusual, seek medical attention rather than relying on an app.
Air indoors is not automatically clean either. Smoke, cooking, poor ventilation and infiltration from outside can all affect it. During severe smoke or pollution events, follow the specific instructions of your local health authority.
The five checks before you act
Check the source. Prefer official monitoring services or a provider that clearly explains its data. An app that hides the source deserves more caution.
Check the timestamp. A reading from hours ago may not reflect a rapidly changing smoke plume or a shift in the weather.
Check the index. Identify the country or agency, the category definitions and the pollutant responsible where available.
Check the place. Ask how far the measurement or estimate is from the activity you are planning, and whether traffic or local conditions could differ.
Check the advice. Read the health guidance attached to the category, then consider your personal circumstances and local warnings.
If any of those details is missing, that does not make the reading worthless. It makes it less suitable for confident, highly specific conclusions.
The global lesson in a local number
An air-quality index is useful because it translates complex measurements into something that can influence everyday decisions. Its simplicity is also its limitation. The colour and number compress questions of geography, time, chemistry and personal vulnerability into a small part of a screen.
The best use of an index is neither blind faith nor dismissal. It is a short pause to ask what was measured, where, when and under which rules. That is a habit you can take from one country to another, even when the colours and thresholds change.
How we verified this report
We reviewed public explanations and guidance from the World Health Organization, the European Environment Agency and the United States Environmental Protection Agency. The article explains how to interpret monitoring information; it does not supply real-time measurements or individual medical advice. Sources were reviewed on 17 October 2026.